|
|
CMoney
趨勢分析的應用 |
|
|
如何30秒內找出目前股價突破年線,且半年線已呈現上揚的個股
運用進階選股的技術面選股,您可以在30秒內得到上述的資訊,並且相同的方式,也一併可運用到基本面、籌碼面、消息面選股之中。
操作步驟
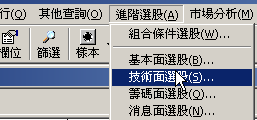
步驟1、開啟進階選股:點選功能表->[進階選股]->[技術面選股]。或左列樹狀圖,點開進階選股,按技術面,在點選滑鼠右鍵,按新增。
| 開啟技術面選股方式一 |
開啟技術面選股方式二 |
|
|

|
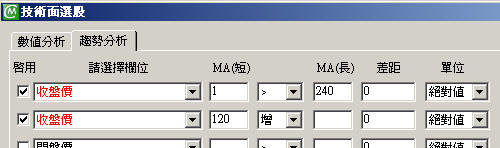
步驟2、設定條件並預覽:按照下圖設定,第一行表示:要找出收盤價大於240日均線者,第二行表示要找出120日均線是增加者(表示均線上揚),完成後按預覽。接下來您可
以直接離開,或將此條件儲存給日後重複使用
(如果您不清楚該設定的定義,可將滑鼠停在紅字上,系統會提示您這項條件的意義)。
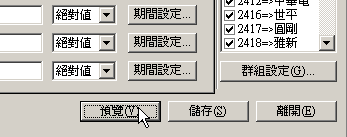
步驟3、瀏覽選出個股:畫面如下圖即是所有符合條件的股票了。
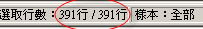
預設的畫面是看這些股票的日收盤,如果您想要知道有多少檔,可點選任一欄位將整欄反白,此時右下角會顯示符合檔數(以2003/6/11為例,有391檔符合),如果您有需要將這391檔作進一步的處理,您可在反白狀況下,按滑鼠右鍵,將其設為選股樣本

 下載這個CMY檔 下載這個CMY檔
|